


 International projectsSTCU 6362Main results
Synthesis of carbon fluoroxide NPs by electrochemical etching and surface modification of NPs by various functional groups to stabilize their properties
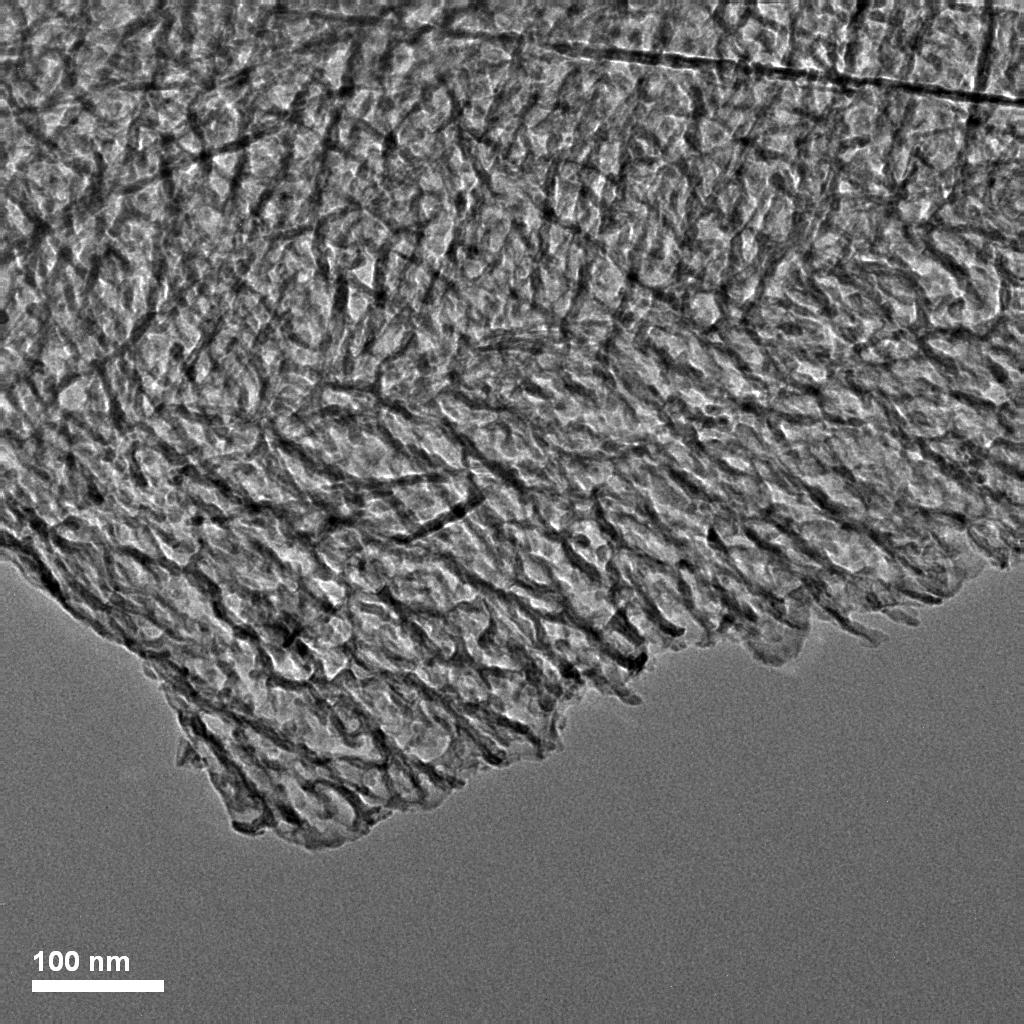
Electrochemical dissolution of highly doped (ρ~1mΩ•cm, n-type) polycrystalline 3C-SiC in HF/H2O and HF/H2O/ethanol solutions allowed production of luminescent porous silicon carbide (por-SiC) and soluble carbon fluorooxide nanoparticles as a byproduct. Chemical, structural and luminescent analysis of initial parameters of nanopowders and colloidal solutions of carbon fluoroxide NPs were fulfilled. The por-SiC is a crystalline material with large pore volume, surface area close to 100 m2g-1, and open meso-porous structure. Depending on the SiC resistivity, etchant composition, and current density, three different types of por-SiC morphology were revealed. The different procedures of NPs functionalization were developed that allow obtaining oxidized SiC NPs (SiC-OX), hydroxylated SiC NPs (SiC-OH), carboxylated SiC NPs (SiC-CO2H). Characterization of the CFO by Mass Spectrometry allowed detection of numerous organic compounds, predominantly ethyl esters of polycarboxylic acids. Presence of such esters in the CFO confirms the formation of polymaleic acid chains as terminal groups of the CFO particle. The quantum yields of the CFO photoluminescence lies in range 0.26-0.44.
|
|
|
|
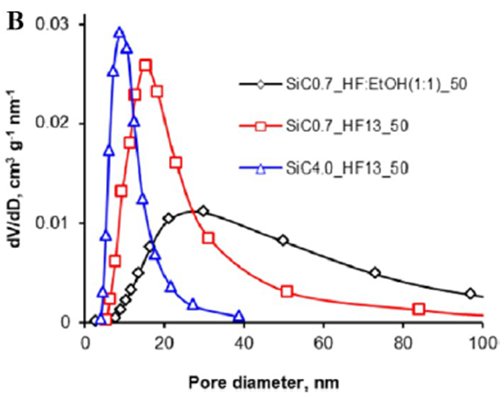
Figure (a) TEM-images of por-SiC sample; (b) Pore size distributions (BJH, desorption), typical of por-SiC samples. |
|
Free standing porous SiC layers for chemical sensors
|
|
|
|
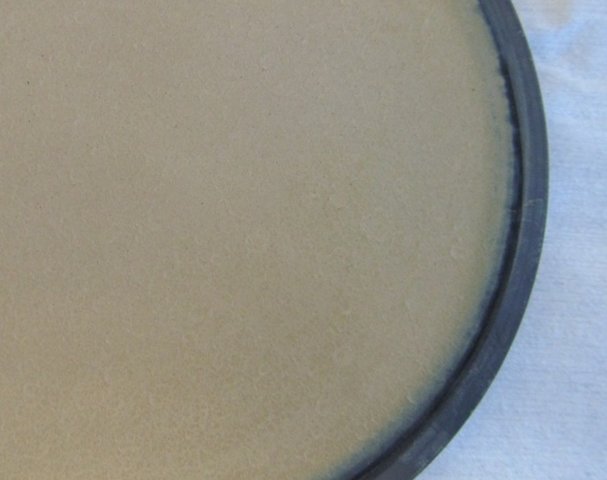
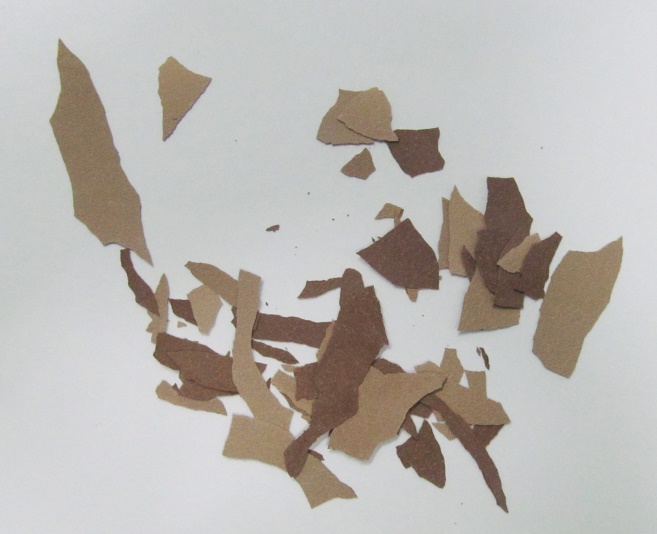
Figure. Optical photos of porous SiC samples before and after removal from the plate |
|
|
|
|
|
Figure. Electronic microscopy images of por-SiC free-layer. A. SEM image of outer surface; |
|
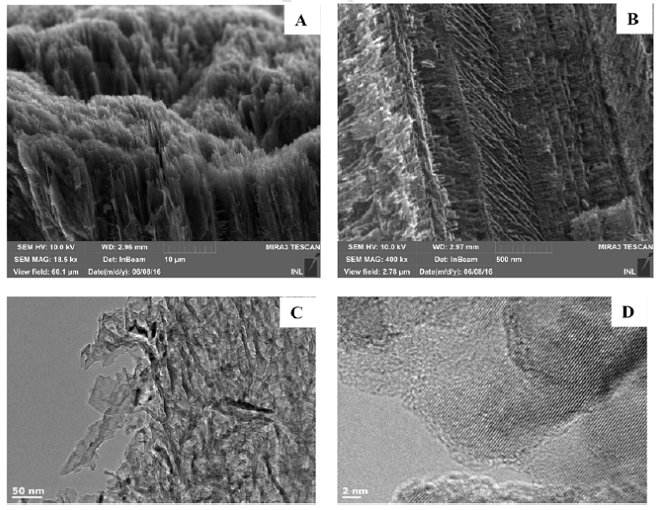
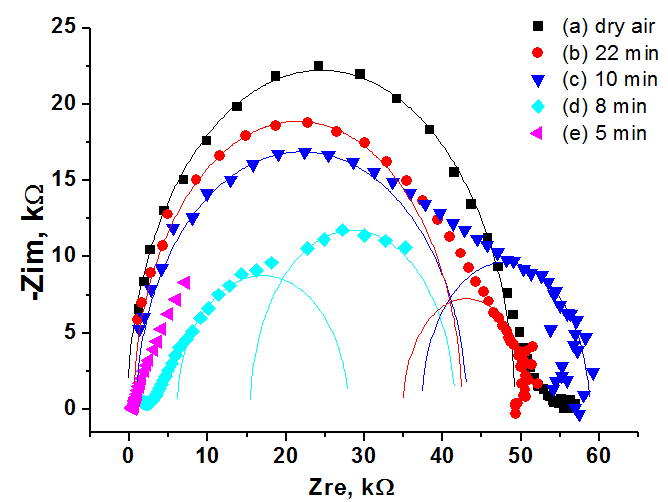
The impedance spectroscopy was applied for analysis the influence of ethanol vapor desorption on the charge transfer of por-SiC layers. It was found that at the initial stage of desorption the impedance plot is described by the Warburg impedance, then it is described by two overlapping nonideal semicircles. While in dry air the impedance plot is described by one nonideal semicircle. The behavior of complex resistivity at adsorption/desorption of ethanol is discussed taking into account the recharge of surface electronic states on SiC surface. The response and recovery times to ethanol molecule adsorption are about 1.41 and 0.95 min, respectively. Our results indicate that freestanding PSiC might be promising material for MEMS gas sensors.
|
|
|
|
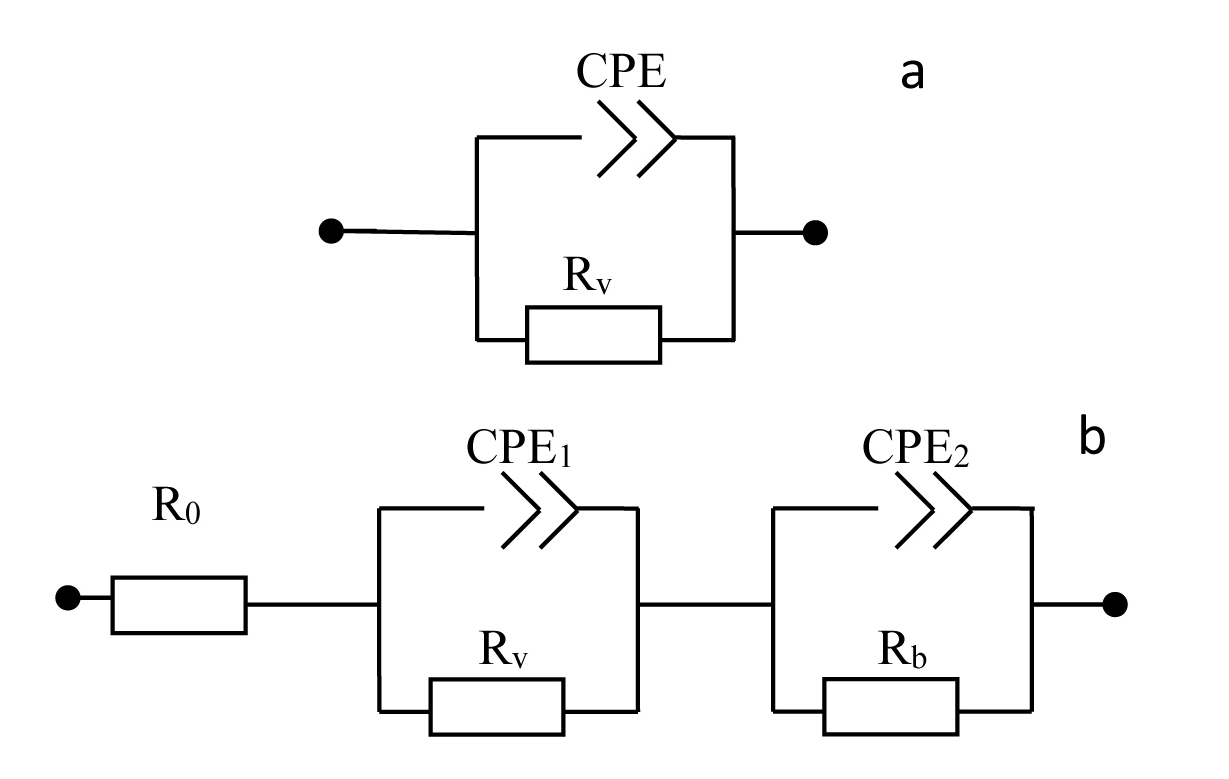
(A) Nyquist plots of por-SiC in dry air (a), after 5, 8, 10, 22 min desorption of ethanol (b,c,d,e) from surface. Points are experiments, solid lines are calculated. (B) Equivalent schema for por-SiC in dry air (a) and after 5, 8, 10, 22 min desorption of ethanol (b) from surface |
|
 |
|
|
Dynamic response signal of a sensor on supplying 3 cycles of saturated vapors of ethanol at pumping through the bubbler at frequency 5 kHz. |
|
Graphene oxide (GO) and reduced graphene oxide (rGO) films
|
|
|
|
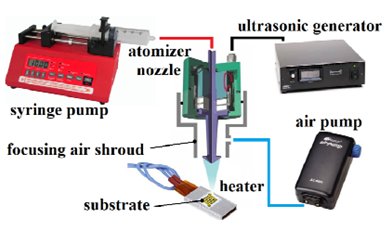
From paper O.M. Slobodian, et al., Reduced graphene oxide obtained using the spray pyrolysis technique for gas sensing, SPQEO, V. 22, N 1, P. 98-103 (2019) : 1) Structural scheme of the ultrasonic pyrolysis system 2) AFM height map of the GO thin film deposited on glass |
|
 1
1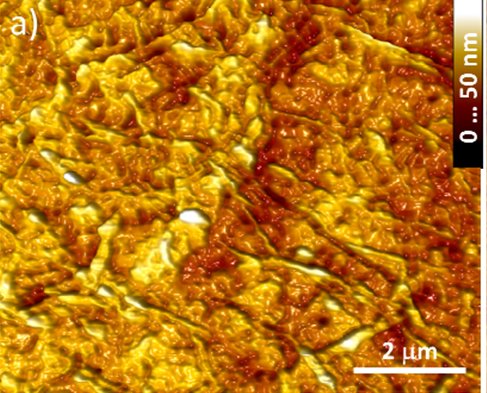 2
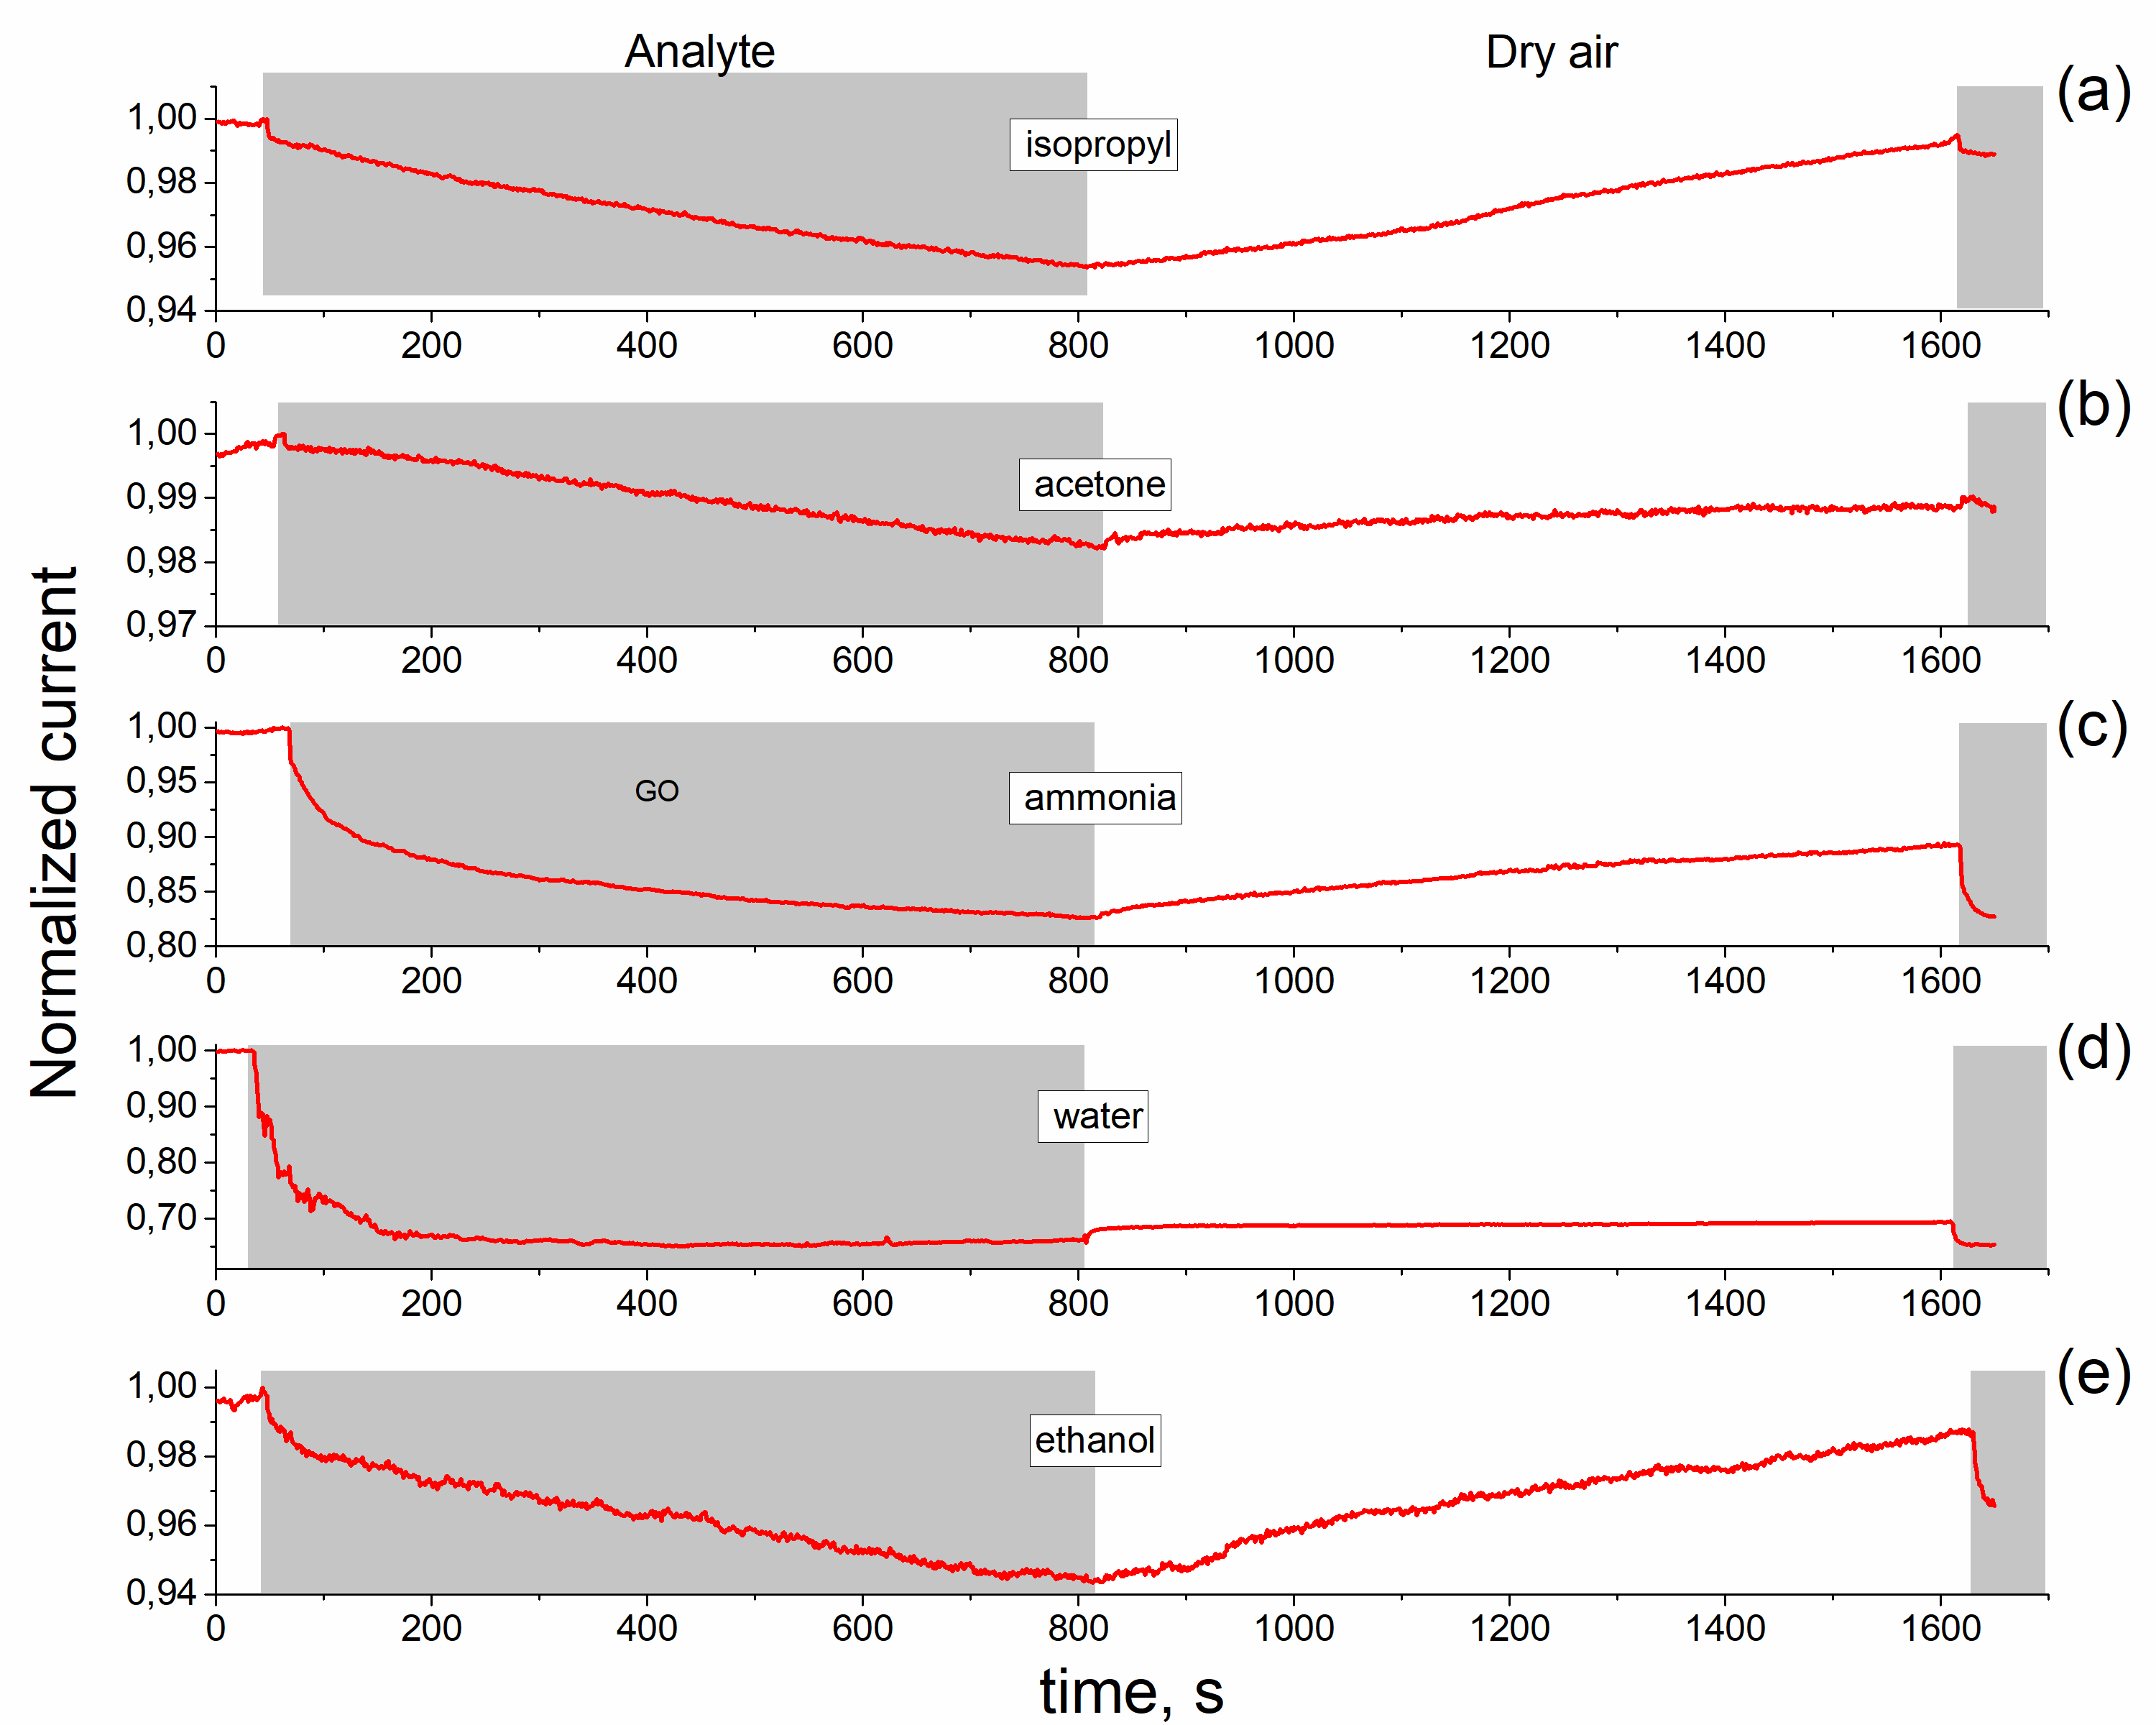
2The graphene oxide films were formed by ultrasonic spray coating method. The reduced rGO films were obtained by the annealing at 230°C for 15 min in ambient air. Raman spectra confirm the formation of GO and rGO films in which D and G bands with maxima at ~1350 cm-1 and ~1590 -1 are observed. The observed one semicircle on the Nyquist curve confirms that elaborated material is homogeneous. It was shown that resistance of the rGO and GO films increases at adsorption of ethanol, acetone and isopropyl vapors but the film impedance is changed by different degrees under exposure in these vapors. The obtained results indicates that GO and rGO layers are promising elements rather for non-specific chemical sensors. The impedance measurement is a useful and sensitive method to estimate the homogeneity of rGO layer and can be used as transducer for organic vapor sensors.
|
|
|
|
|
|
|
Nyquist curves of rGO film in dry air (a), saturated vapor of ethanol (b) and acetone (c). Points - experiment, lines - calculation from eq.1.2. Equivalent scheme of rGO film (d). |
|
 |
|
|
Time dependences of normalized current (for 1 V applied voltage) for #2 sample, measured under (a) acetone, (b) ammonia, (c) water vapor and (d) ethanol vapor |
|
Development and optimization of the synthesis of luminescent SiO2:C nanocomposites
 |
|
|
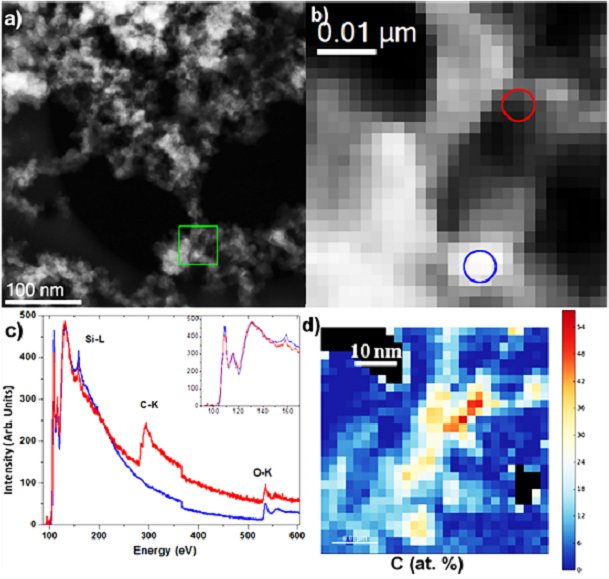
Fig. (a) STEM micrograph of the SiO2:C nanopowder annealed at 600C. The green square highlights the area used for the SR-EELS analysis; (b) STEM dark field micrograph recorded at the same time that the SR-EELS data/ The red and blue circles correspond to the area in which the red and blue EELS spectra of (c) have been taken. (d) Map of the atomic concentration of carbon as determinated from the EELS quantification. (From A.V. Vasin et al., Multiband light emission and nanoscale chemical analyses of carbonized Fumed silica, Journal of Applied Physics, V.124, 105108 (2018)) |
|
 |
|
|
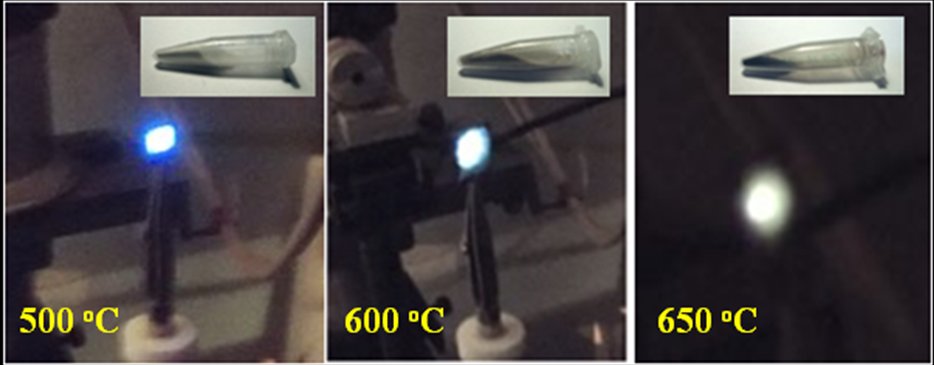
Photo-images of the PL emission in annealed phenylsilicas under excitation by 409 nm LED. |
|
 |
|
|
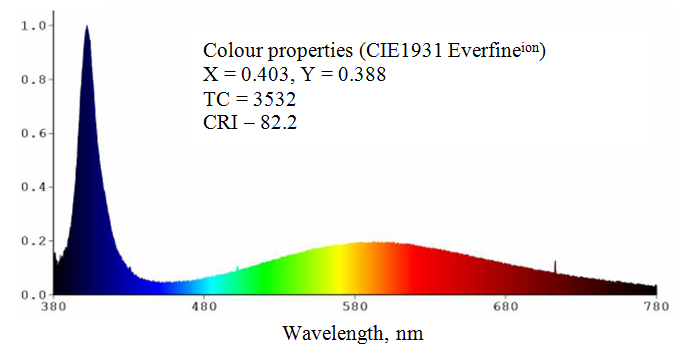
Figure demonstrates spectral properties of 401 nm LED excited SiO2:C phosphor on the base of carbonised fumed silica. Such white light source exhibits high color rendering index |
|
The evolution of PL properties associated with the carbonization of fumed silica in broad temperature range has been followed. That has done by using different surface hydrocarbon precursors, with a gradual transition from organic molecular-like groups to inorganic amorphous carbon precipitates. Independently of the carbon precursor used for pyrolytic carbonization, two types of PL bands in the near UV and visible regions, can be observed with their relative contribution depending on samples preparation. Based on the analysis of emission/excitation of these two bands, as well as on correlations with the synthesis conditions, a structural-energy concept of light-emitting centers has been proposed.
 |
|
|
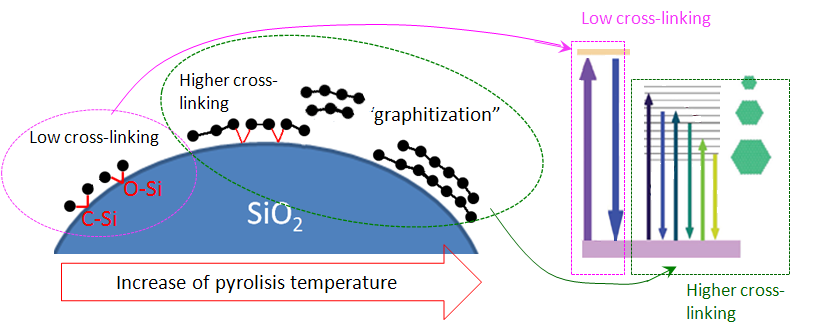
Suggested structure/energy scheme of carbonized silica surface and its evolution under thermal treatment |
|
Development of porous carbon thin films for chemical sensors
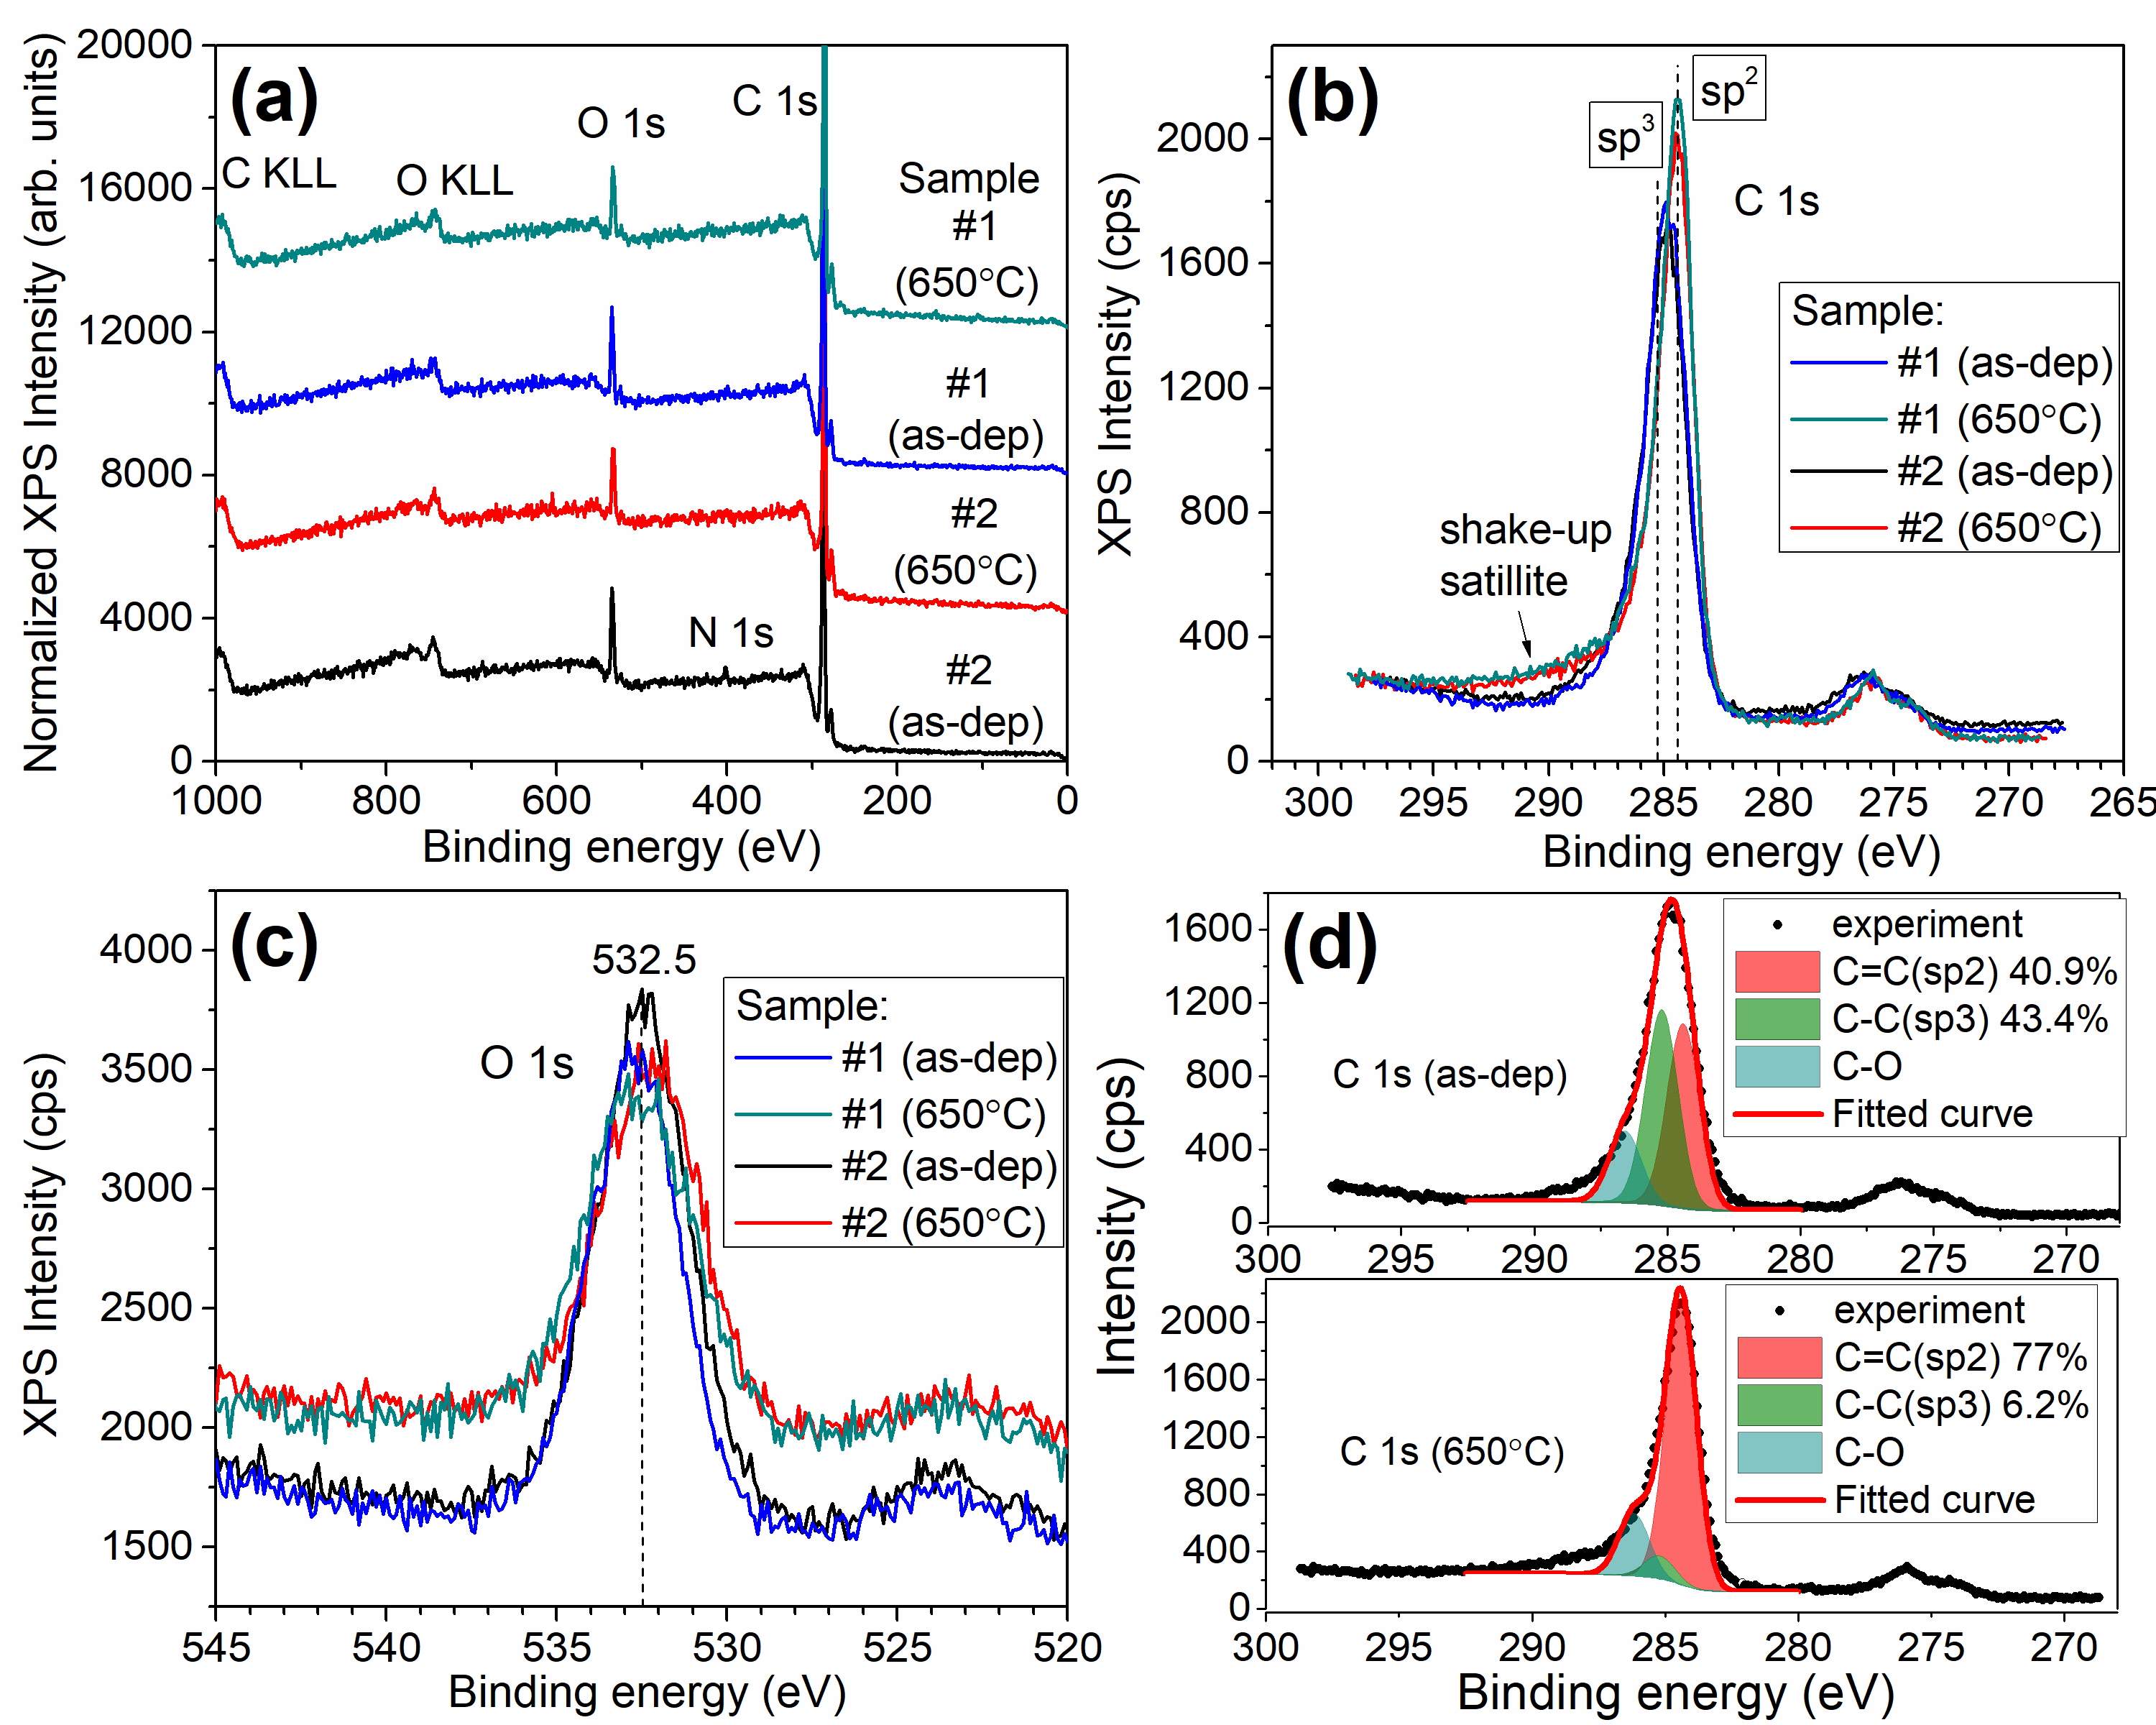
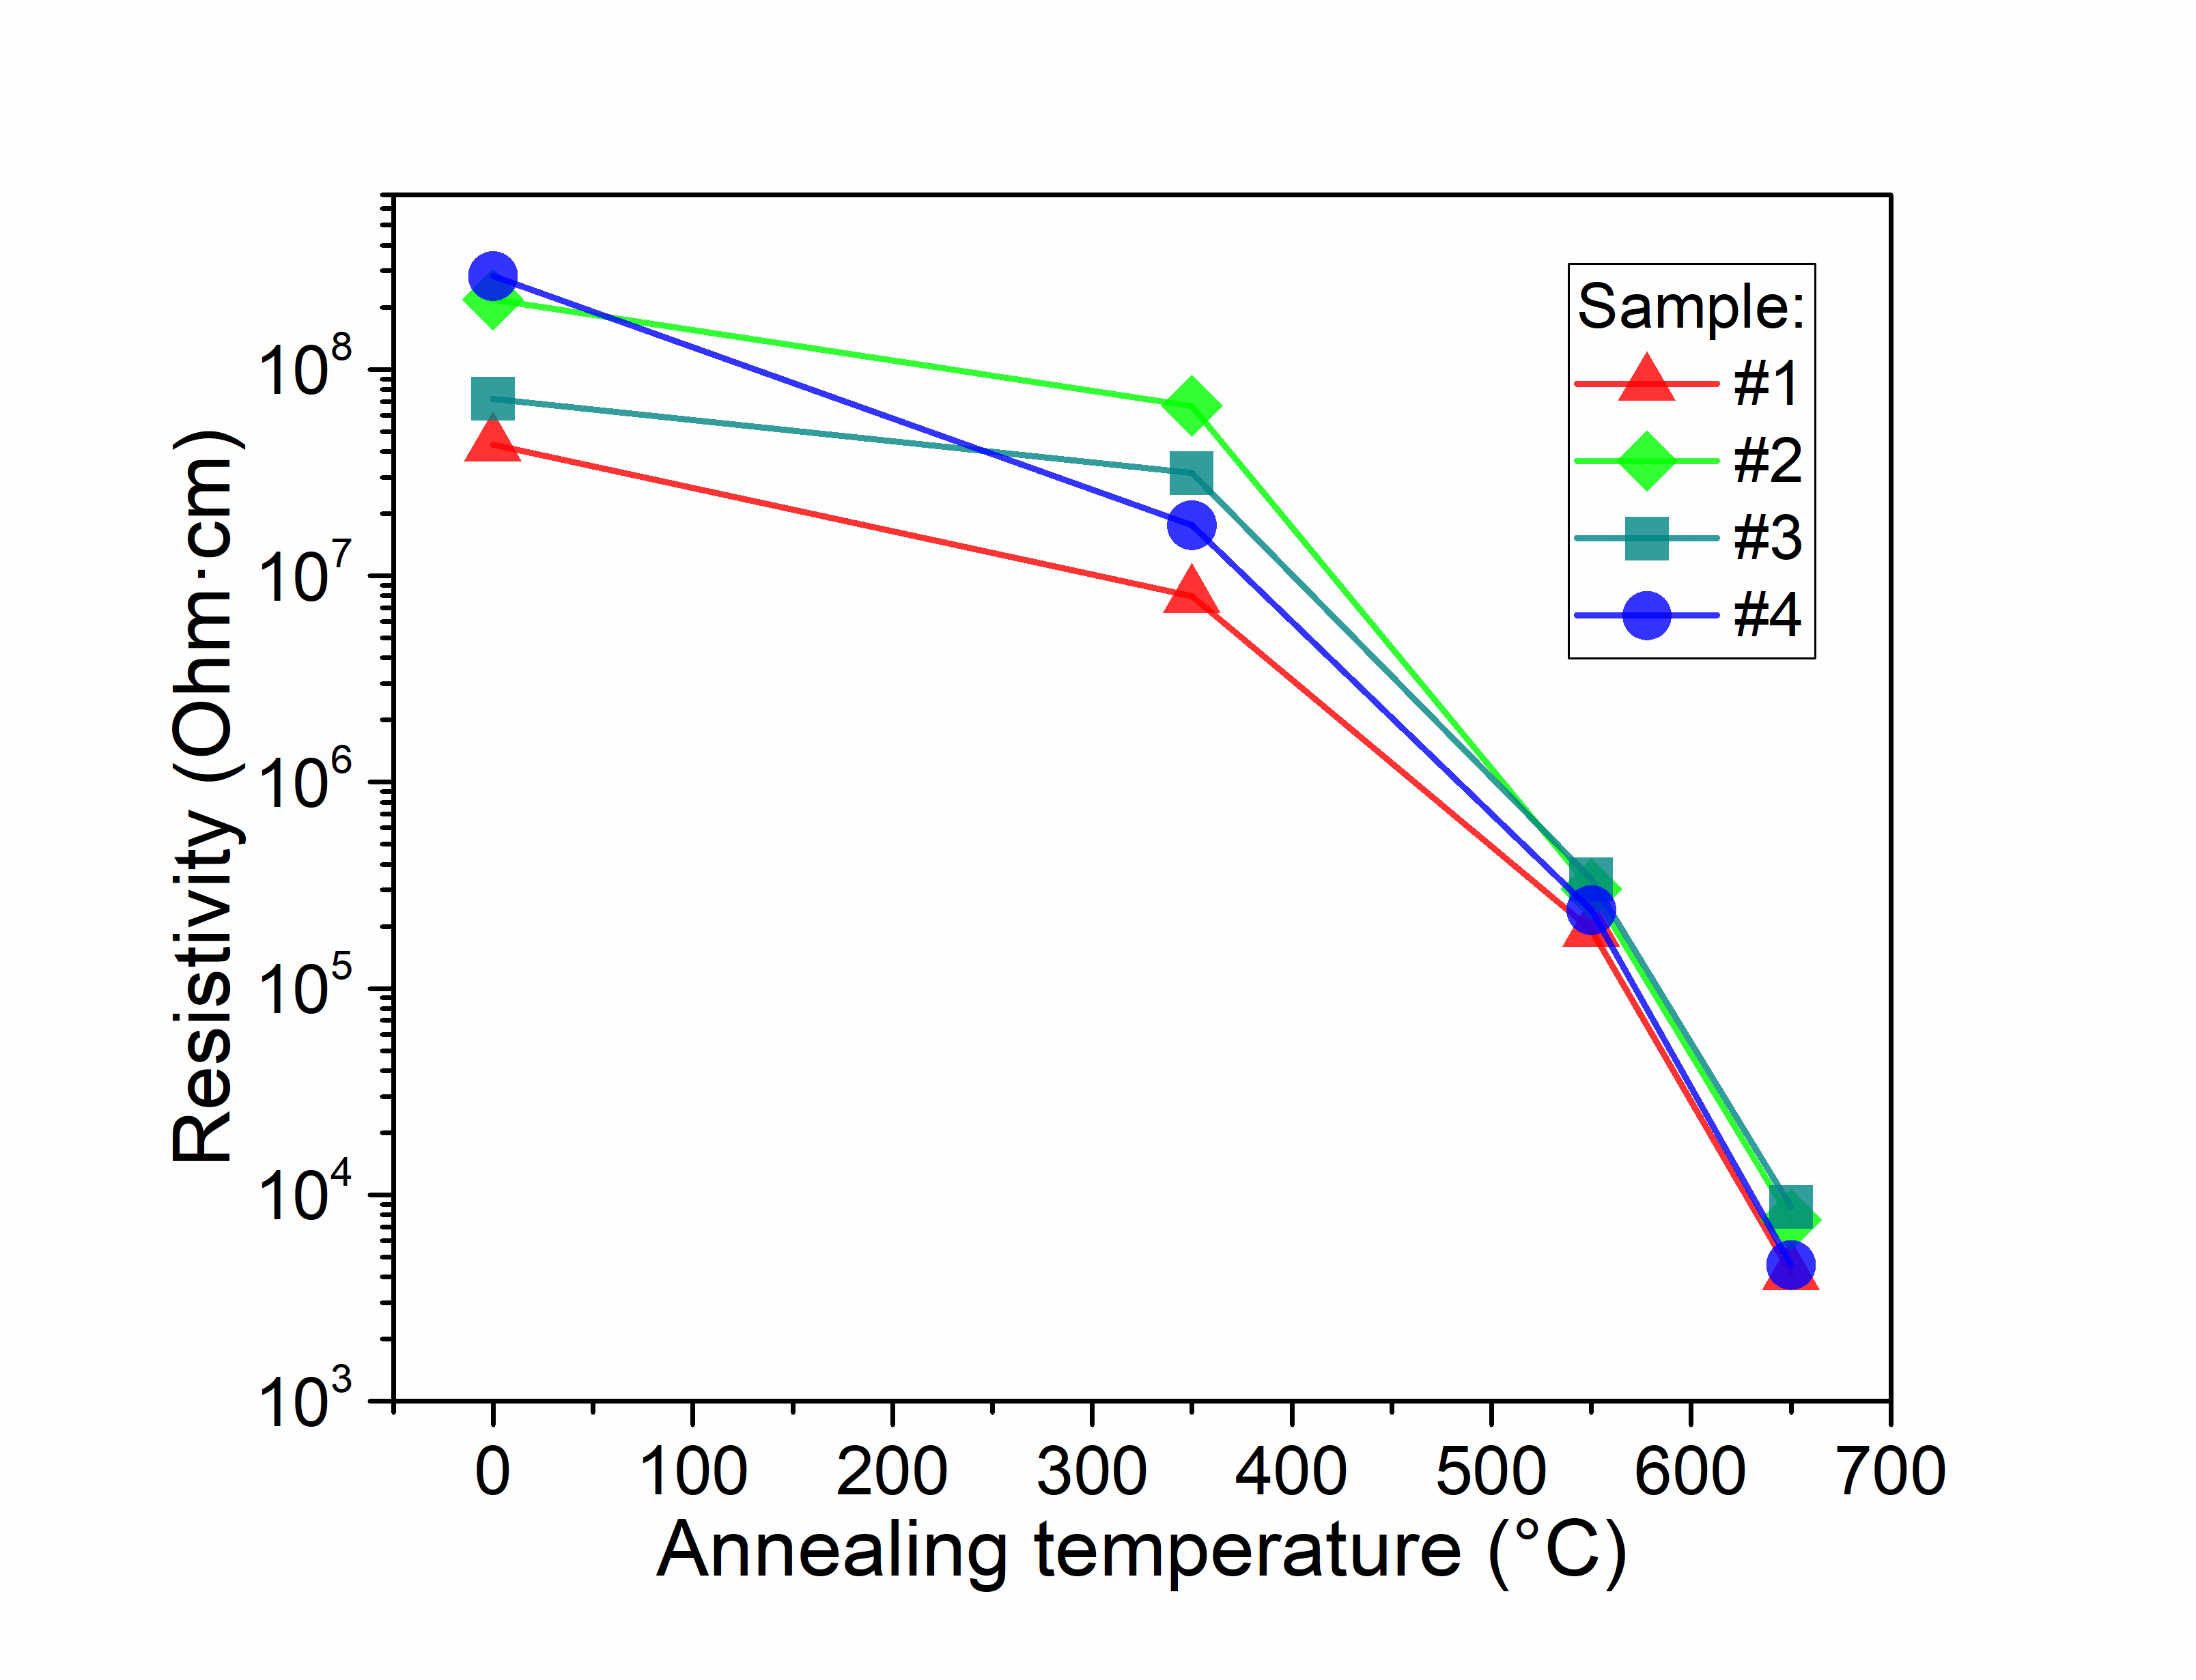
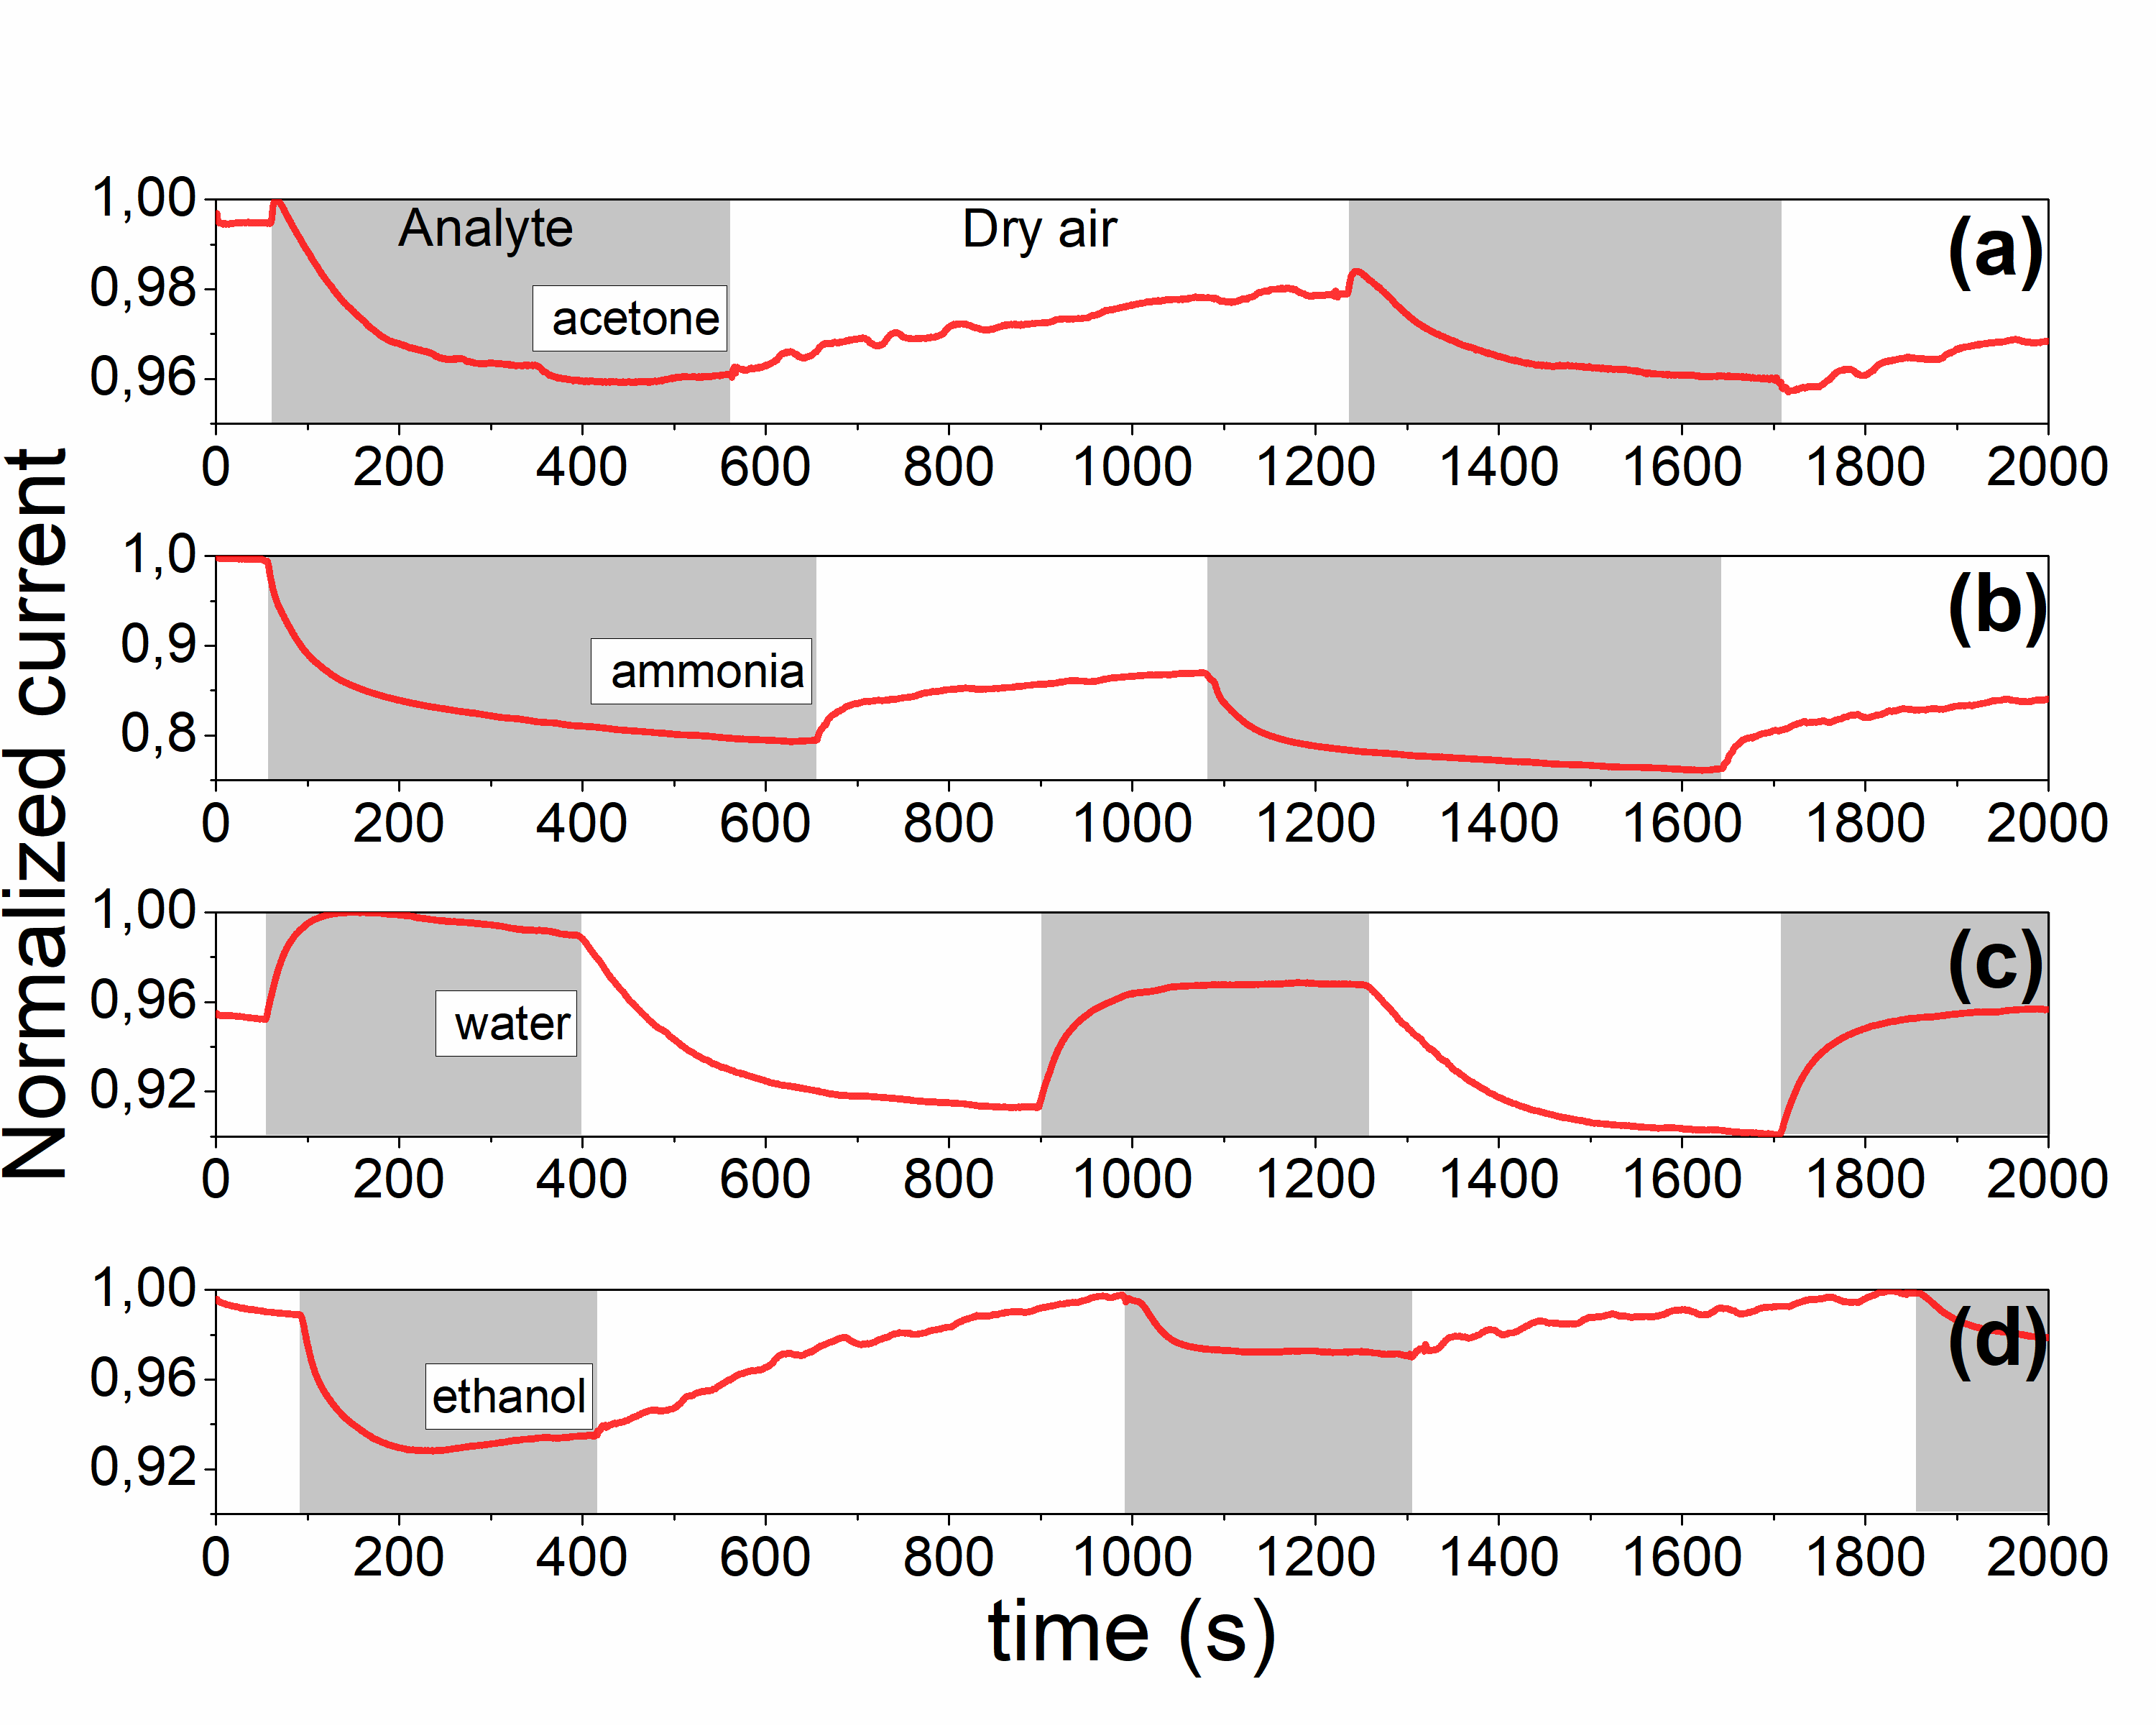
The new method of formation of high porous graphite-like thin films by RF magnetron plasma enhanced chemical vapour deposition from argon-methane gas mixture followed by annealing at 650°C, is suggested. Films were characterized by XPS, XES, FTIR, Raman spectroscopy, XRD, XRR, AFM, and electrical measurements both, before and after thermal annealing. Deconvolution of XPS spectra has demonstrated a significant growth of sp2/sp3 ratio from 1 for as-deposited to 12 for annealed at 650 °C for 5 min films. FTIR spectra have confirmed that thermal annealing results in reduction of H- and OH- functional groups and formation of Ñ=Ñ bonds. The analysis of Raman spectra has shown that the high-temperature annealing incorporates additional defects in graphite plane. XRD method showed that films are amorphous. Estimation of porosity from XRR measurements gave values of about 59% for as-deposited films and 34% for annealed films. AFM has shown that RSM roughness of the films decreases from 3.3 to 0.6nm during treatment at 650°C for 5min in inert atmosphere. Pores size was found to be few tens of nanometres. As it was shown from electrical measurements, annealing decreases resistivity up to 5 orders of magnitude. Annealed films have demonstrated perceptible sensitivity to ammonia and water vapours.
 |
|
|
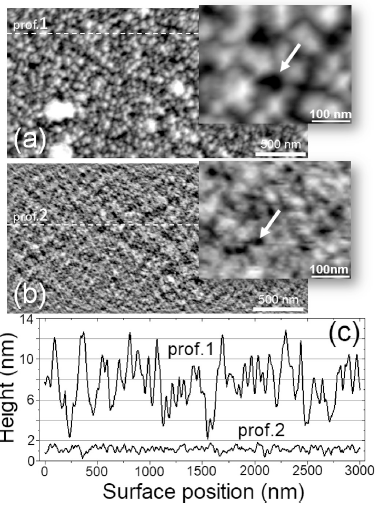
Figure. Deconvolution of AFM images for as-deposited (a) and annealed at 650 °C (b) carbon films (Sample #3). Corresponding cross-section profiles of surface relief are shown in (c). Pores indicated by arrows in enlarged fragments of corresponding images. (From O.M. Slobodian, et al., Highly porous carbon films fabricated by magnetron plasma enhanced chemical vapor deposition: Structure, properties and implementation, Applied Surface Science V.496, 143735 (2019)) |
|
 |
|
|
XPS data obtained for the porous carbon films. (a) survey spectra of two samples (#1 and #2), (b) C 1s core-level spectra and (c) O 1s core-level spectra for both as-deposited and annealed at 650°C films. (d) Deconvolution of C 1s spectra for sample #1 before and after annealing at 650°C |
|
|
|
|
|
Carbon films resistivity vs. annealing temperature |
Time dependences of normalized current (for 1V applied voltage) for #2 sample, measured under (a) acetone, (b) ammonia, (c) water vapor and (d) ethanol vapor |
Back to Top 
|